The Nuke Map Reality: Visualizing the True Scale of a Nuclear Blast in Your City
The Nuke Map Reality: Visualizing the True Scale of a Nuclear Blast in Your City
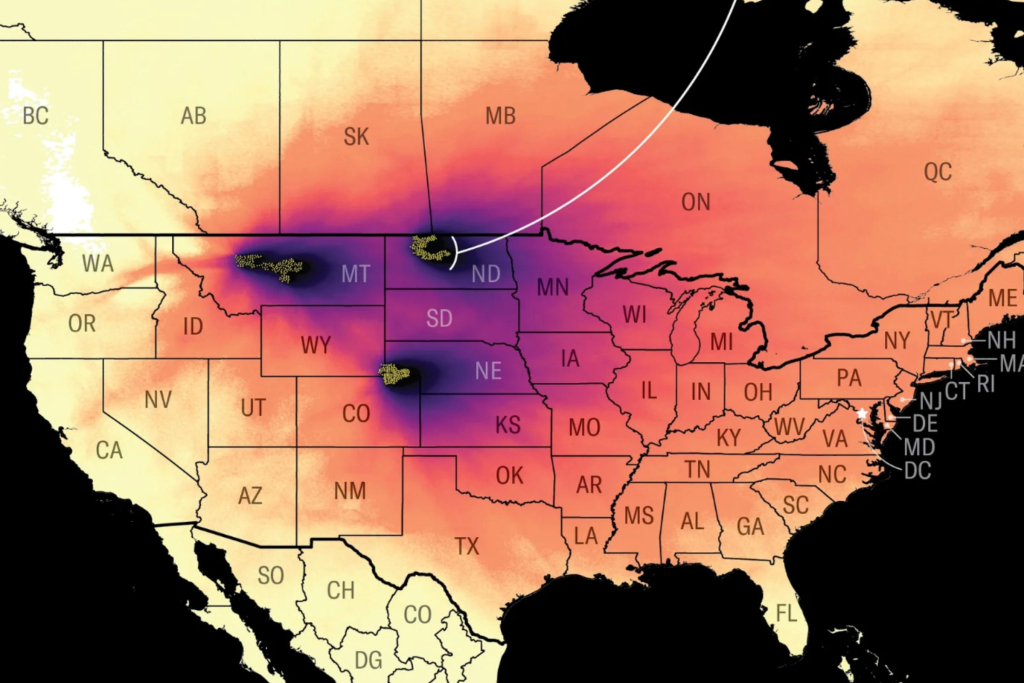
The Nuke Map, an online interactive tool, simulates the potential impacts of a nuclear detonation anywhere on Earth, illustrating the catastrophic radius of blast, heat, and radiation effects. Created by data scientist and historian Alex Wellerstein, the map serves as a stark visualization device, translating complex weapon yields and atmospheric physics into concrete geographic boundaries. It does not predict an imminent attack but functions as a persistent educational instrument, forcing a global audience to confront the specific, horrifying dimensions of nuclear warfare.
The genesis of the Nuke Map lies in the academic and historical study of nuclear weapons, rather than in any contemporary military planning. Alex Wellerstein, a historian of nuclear weapons at the Stevens Institute of Technology, developed the underlying computational model, termed “Nuclear Weapons Effects,” drawing upon declassified documents and established physics to calculate potential outcomes. The tool translates abstract kiloton or megaton yields—the standard measure of a bomb's energy release—into tangible consequences for any populated location on the globe. It is a digital embodiment of Cold War-era civil defense pamphlets, updated for the interactive internet age, allowing a user in Tokyo to simulate a hypothetical blast in Moscow or a hypothetical device in their own backyard.
Understanding the specific zones projected by the Nuke Map requires dissecting the physics of a nuclear explosion. The map typically presents three primary impact zones, each representing a different mechanism of destruction.
- The Initial Fireball: This is the intensely hot, glowing sphere of superheated air and vaporized material at the point of detonation. Its size is directly determined by the weapon's yield. A 15-kiloton bomb, similar to the one dropped on Hiroshima, would create a fireball roughly 0.2 miles (about 1,000 feet) in diameter. Anyone inside this zone would be incinerated almost instantaneously.
- The Blast Wave: This is the most widespread destructive force, responsible for the majority of the physical damage to structures. The map illustrates this as a series of concentric circles indicating varying levels of destruction. The "Severe Damage" zone, where most buildings would be destroyed and fatalities widespread, expands significantly with each increase in yield. A 1-megaton bomb, for instance, would have a severe damage radius exceeding 7 miles.
- The Thermal Radiation Zone: This accounts for the intense heat and flash burns caused by the blinding light of the explosion. The map shades this area to indicate the likelihood of third-degree burns, which can occur many miles from the hypocenter, depending on weather conditions and the weapon's power.
The utility of the Nuke Map extends beyond theoretical physics, serving as a powerful pedagogical instrument. In an era where the threat of nuclear conflict is often discussed in vague, abstract terms, the tool provides a chilling specificity. It transforms a hypothetical "nuclear winter" or "mutually assured destruction" into a map of one's own city, populated with recognizable landmarks and neighborhoods. This personalization is a core part of its impact. Wellerstein has stated that his goal is not to induce panic but to foster a more informed public dialogue. "I am not a policy expert," he has noted, "but I think it is important for people to understand the reality of these weapons, to understand the scale of what they are talking about, rather than using numbers that are just abstractions." By making the invisible scale of a nuclear weapon visible, the map challenges users to move beyond clichéd notions of mushroom clouds and consider the granular, human suffering within the calculated radii.
While the Nuke Map is a static simulation based on predetermined variables, its presentation forces a confrontation with the volatility of global politics. The parameters of the simulation—be it a North Korean ICBM test-fired toward the Pacific or a hypothetical escalation between major powers—are user-defined. This interactive element places a significant responsibility on the user, turning a passive observer into an active participant in a grim thought experiment. The map underscores a critical truth: the destructive power of modern thermonuclear weapons operates on a scale that defies conventional comprehension. A single modern missile can detonate with a force equivalent to tens of thousands of the Hiroshima bombs, creating casualty zones that span over a dozen miles. The tool does not sensationalize this fact; it simply calculates it. In doing so, it provides a unique service, a digital ground zero where the abstract doctrines of deterrence and mutually assured destruction become horrifyingly concrete. It is a cartography of catastrophe, a necessary reminder of the potential consequences that remain, however distant, embedded in the geopolitical landscape.
Related Post
Revolutionizing Nuclear Fallout Maps: Uncovering the Power of Nuke Map

Sade's Enigmatic Daughter: A glimpse into the life and career of Maui Taylor Siddiq

Alyson Hannigan: A Timeless Beauty - 50 Hot Pics to Prove Her Enduring Sex Appeal

Holland, MI School Closings: Understanding the Impact and Why It Matters